State fund becomes market player
Tuesday, March 21, 2006
ENOCH YIU and BEI HU
The National Council for Social Security Fund (NSSF) has opened an account in the local stock market's clearing house, indicating that it has successfully lobbied mainland authorities to allow it to receive shares, rather than cash, from the initial public offerings of state-owned enterprises.
Market sources say that such a major policy shift will mean the giant pension fund is in a position to boost its funding through H-share initial offerings.
Under rules introduced in 2001, all state shareholders selling stakes were required to give 10 per cent of the proceeds of new listings to the NSSF, the fund of last resort designed to plug holes in provincial social security systems.
Sources say Bank of China, due to list in Hong Kong in May, could be among the first big initial offerings to pay the NSSF in shares.
The plan still faces objections from China SAFE Investments, the bank's dominant state shareholder, which argues the NSSF had already agreed to a pre-offering investment of 10 billion yuan.
The first company to be affected by the rule will be Hunan Nonferrous Metals Corp, which launches its initial offering today and give a 3.3 per cent stake to NSSF.
Tony Espina, chairman of the Hong Kong Stockbrokers Association, said the new policy would silence mainland critics who had long complained that the listing of state-owned enterprises in Hong Kong would permit them to fall into the hands of overseas investors.
"The NSSF will be able to hold on to these stocks in the long term, receiving dividend income and the capital gains from these IPOs," Mr Espina said. "It means that H-share listings will benefit the national pension funds and the future pensioners of China."
Previously, the NSSF was paid in cash from Hong Kong offerings, allowing it to invest the proceeds only in bank deposits or bonds with low returns of just 3 per cent a year.
Big Name Bets on Small Deals
Goldman FindsGrowth on the Cheap In Hong Kong-Listed Firms
By KATE LINEBAUGHMarch 21, 2006; Page C14
HONG KONG -- Investors hunting for small China or Hong Kong plays might consider following the money. Goldman Sachs' money.
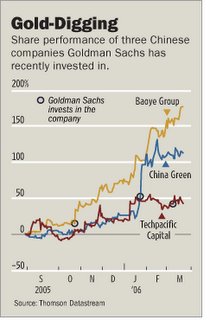
In recent months, Goldman Sachs Group Inc. has invested US$140 million in three small Hong Kong-listed companies in businesses ranging from construction to gas exploration. Buying either equity or equity-linked securities, the New York investment bank has helped fund these thinly traded and capitalized companies, which aren't in a category generally associated with one of Wall Street's premier names.
Should investors follow Goldman's lead? In Asia, the combination of low valuations and solid growth prospects can make less-recognized names a lucrative opportunity, some investors say. But many of those stocks have already performed strongly this year, thanks in part to an influx of foreign money -- such as Goldman's -- into one of the world's fastest-growing regions.
Goldman, which last week reported a 64% increase in fiscal first-quarter net income to a record $2.48 billion, is hoping that taking on more risk both for clients and on its own books will yield better returns.
"They are the first of the big names to invest in the small entrepreneurship area," says Yang Liu, a portfolio manager in Hong Kong for Atlantis Investment Management. "I think that this game has just started."
In November, Goldman bought a 17% stake in Baoye Group, a private-sector Chinese construction company based in Zhejiang province with more than 40,000 employees. With the HK$209.3 million (US$27 million) of proceeds from the sale of new shares, Baoye has begun expanding into other provinces. Last week, it announced a HK$127.7 million purchase of Hubei Construction Group.
Goldman's investment came after the stock already had roughly tripled from a public offering price of HK$1.43 a share in 2003. Still, the shares have more than doubled since Goldman's entry, closing at HK$12.75 a share yesterday. (Goldman paid HK$4.85 a share, a 7.6% discount to Baoye's market price of HK$5.25 on Nov. 3.) Since the beginning of the year, Baoye's shares have risen 59%, in line with a rally of China stocks.
In January, Goldman invested HK$312 million in China Green, a private-sector agricultural company in Fujian province, to help it finance a food-processing center in Shanghai. Goldman bought a five-year convertible bond and was paid HK$12.2 million for managing the deal.
When China Green went public in January 2004, it set a Hong Kong record, as retail investors ordered 1,600 times as many shares in the initial offering as were available. That demand spawned a 58% price jump on the first day of trading to HK$2.025, though the shares then languished and took nearly two years to reach that level again.
On Jan. 25, the day Goldman struck its deal, China Green's shares closed at HK$2.50. Since then, they have risen 45% to HK$3.625 -- well above the HK$2.655 price at which Goldman can convert the debt into equity. China Green's shares are up 69% this year.
Whether Goldman just knew a good time to get into these small China plays or whether its capital fired them up -- or both -- the investment bank's strategy is worth watching.
To be sure, Goldman has put money down in large China investments, too. Alongside its private-equity arm, Goldman invested $2.58 billion in China's biggest bank, Industrial & Commercial Bank of China.
But the two small investments, about which Goldman declined to comment, have drawn attention.
"It's just a trend for investment banks to spot out viable small- and mid-cap stocks and take a significant stake by way of equity or convertible bond," says Andy Mantel, managing director at Pacific Sun Management in Hong Kong. Mr. Mantel, who owns China Green shares, says the company trades at about seven times his forecast of 2007 earnings. He estimates sales will hit US$100 million that year. In the six months ended Oct. 31, company revenue was US$32 million.
Most investment banks have proprietary trading operations, for their own accounts, and make investments that generally aren't publicized. Because Goldman's two Hong Kong investments crossed certain thresholds, they were publicly disclosed to the city's stock exchange by the companies themselves.
For Goldman's private-equity arm, buying into obscure companies, with limited opportunities for advisory fees, isn't typical. It usually looks to leverage investments in companies into such fees when they do a deal or go public.
Many investors are looking at China in search of higher returns. And huge funds are available. Globally, private-equity funds raised US$246 billion last year, compared with US$97 billion in 2003, according to Thomson Venture Economics. Goldman is part of the trend, making investments -- and, like specialized Asian investors -- using its regional experience to find capital-hungry Hong Kong companies that have low valuations but good growth prospects.
"Most of your returns should be coming from this area," says Ms. Liu of Atlantis, "but they require tremendous expertise."
Goldman's latest deal, with Techpacific Capital this month, veered into different territory, with no China angle.
With interests from London to Japan to Louisiana, Techpacific changed into a merchant bank-cum-gas exploration company after the collapse of the technology market made its original mandate, as an incubator for technology companies, untenable. Techpacific is a holding company with an 81% stake in London-listed merchant bank, Crosby Capital Partners, which in turn owns 28% of a Japan-listed company, IB Daiwa.
To raise capital for IB Daiwa's gas-exploration projects at three Louisiana sites, Techpacific began talking to bankers to sell a bond convertible into Techpacific's shares and exchangeable into those of Crosby. That is when Goldman swooped in, offering to take the deal on its own books without a road show.
On March 6, the two parties the completed the US$75 million deal. The five-year bond is convertible into Techpacific's shares at HK$0.7665 or exchangeable into Crosby shares at 99.75 pence (US$1.75). At the time, Techpacific shares were trading at HK$0.75. Subsequently they rose to HK$0.81, but yesterday were back to HK$0.75. Goldman may have sold some of its exposure to DKR Capital Partners, a Stamford, Connecticut, hedge fund that disclosed an interest in Techpacific to Hong Kong's stock exchange. Goldman declined to comment.
Write to Kate Linebaugh at kate.linebaugh@wsj.com
China: What Next?
Andy Xie (Hong Kong)
*****Overcapacity is causing investment slowdown: I estimate that fixed investment in industries that are experiencing overcapacity contributed 40-50% of GDP growth in 2005. Without other components of the GDP accelerating, China’s economy should slow in 2006.
*****Spending more on infrastructure won’t reverse the trend: The infrastructure areas that can justify more investment account for 4% of total investment, I believe. Spending more there won’t reverse the trend.
*****Stimulating property again could lead to another wave of bad debts: Giving property a second wind is a popular proposal for stimulating the economy. Cutting mortgage rates could boost sentiment. However, it would mostly encourage more speculation. The industry is already swollen and highly speculative.
*****Lifting consumption is hard to do: The main problem for consumption is the low income and wealth of the household sector. To solve the problem, the government could securitize its assets for distribution to the population, which could create a consumption boom for several years. However, vested interests may prevent such a policy change.
Summary & Conclusions
China is running into serious overcapacity. On the demand side, I estimate fixed investment accounted for 58% of China’s GDP growth over 2000-05 and the current account 9%, using revised-up GDP as a benchmark. Of course, on the income side, export growth has accounted for most of the increase that has funded the fixed investment expansion.
Overcapacity is likely to force China to slow down fixed investment. In addition, I expect export growth to slow down to 15% in 2006 from 28% last year due to deceleration in factory relocation. What could sustain China’s high growth rate in 2006?
Property is widely discussed as the best option. China has vast overcapacity in steel and cement. Property is the primary user of both. This is why pushing property has become an attractive option. This sort of planning mentality could create another wave of bad debts, I believe, and cripple China’s economy for years to come.
The signal for a property push would be a cut in mortgage rates. If this were to occur, the market could become euphoric again. I doubt that it would push up physical demand significantly. The disconnect between price and supply is too big to overcome simply via a reduction in mortgage rates. Prices need to come down substantially to clear current supply and support more supply to boost GDP. I think another wave of bad debts would be inevitable from such a bubble push for GDP growth.
Infrastructure is considered an alternative. In terms of its fiscal situation, the government has ample room to stimulate. Infrastructure is overbuilt in most areas already, though. I believe a big push in selected areas (e.g. water and environment) would be worthwhile, but the potential boost from such areas would be insufficient to offset the overcapacity-induced investment slowdown or export deceleration.
Consumption is the alternative that receives the most coverage, but rarely receives serious attention when it comes to policy changes. China’s relatively weak consumption is due to demographics, skewed income and wealth distribution, arbitrary healthcare costs, and high property prices. The government could securitize and distribute government-owned assets to boost consumption quickly. Fixing the healthcare system and maintaining affordable property prices would boost consumption over the long term.
Accounting for GDP Growth
China’s national accounting data are very confusing. The latest revisions make it even more complicated. My suspicion is that the revised total value of GDP is closer to reality than the old value, but is on the high side of the potential range. Rmb18.2 trillion of 2005 GDP no longer underestimates China’s GDP, in my view.
China compiles production data most diligently – a legacy of the planning economy. Demand side data are woefully inadequate. The income side data are missing. I have roughly estimated the various components of China’s national accounts on the demand and income side. In the text below, I provide a breakdown of my methodology in deriving these ‘guesstimates’.
China keeps the most detailed information on production side data. Such data are the most difficult to verify. There are millions of business units in China. The market can check only the accuracy of trends by following selective corporate production data. For example, the decoupling of electricity and industrial production in 1998 was cited as the main evidence of overstatement of GDP growth at that time. On aggregate production data, we have to use whatever is available from the National Statistics Bureau.
On the demand side, China keeps detailed data on fixed investment. Since central or local government has to approve virtually all significant investments, I assume that the data largely reflect reality. I suspect the main inaccuracies relate to the extent to which funds for investment are diverted for consumption. I would not be surprised if this sort of double counting represented as much as 10% of the investment amount. To allow for this, I assume Rmb8.1 trillion for fixed investment in 2005, compared with Rmb8.9 trillion in the monthly fixed investment data series.
I derive a net export figure from my current account (CA) balance estimate. The differences between net exports and the CA balance have been erratic in recent years. The CA surplus was 40% higher than net exports in 2004. This is attributable to hot money inflows disguised as CA items. I estimate the CA surplus reached around Rmb 1.3 trillion in 2005. Considering that hot money inflow slowed substantially in 2005 compared with the year before, I consider a figure of Rmb1 trillion reasonable for net exports in 2005.
The difference between GDP and fixed investment plus net exports is consumption. This number is also relatively simple for most people to estimate – we all have a reasonable feel for our own consumption, and how this compares with the average. Multiplying that by the population is consumption. Rmb9.1 trillion for China’s national consumption feels about right to me. I use the 2004 distribution shares of consumption among urban, rural, and government to divide Rmb9.1 trillion among the three sectors.
The revised production data show that nominal GDP rose from Rmb9.9 trillion to 18.2 trillion between 2000 and 2005. I estimate that fixed investment rose from Rmb3.3 trillion in 2000 to 8.1 trillion in 2005 (accounting for 58% of the GDP growth), while net exports rose from Rmb 224 billion in 2000 to Rmb1 trillion (accounting for 9% of the GDP growth).
On the income side, I identify Rmb3.1 trillion of household savings in household savings deposits, a rise in mortgage downpayments and principal paydown, life insurance and pension assets. Added to household consumption, this implies total household income of Rmb10.2 trillion in 2005. It suggests 30% of household savings deposits, which seems not unreasonable.
Government income is the proceeds that the government uses to consume and invest, of which consumption is Rmb2 trillion and investment about Rmb0.5 trillion. This item is not big in other economies, but is very large in China due to the dominant role of the government in the economy.
Monetization of natural resources is a big part of China’s GDP. Oil, coal, and land are the three big ticket items. The income from these sources usually goes into investment through local government or SoE accounts. I estimate that the profit component through the production chain in monetizing such resources was about Rmb1 trillion in 2005.
Other sources of profits are primarily from state-owned monopolies (e.g., banks, telecom companies, utilities, etc.), export companies, property companies, and foreign owned businesses in the consumer sector. Based on profitability trends in companies’ reported data, I derive very rough profit estimates for these segments in 2005, as follows: the state-owned companies ex-the resource sector probably earned Rmb500 billion last year; exporters saw a net profit margin of about 3% on US$762 bn of exports (i.e. Rmb 185 bn in net profits); property developers probably earned Rmb200 bn, foreign companies in China’s domestic market probably earned Rmb 200 bn, and all other companies probably earned another Rmb200 bn. This produces a total of Rmb1.3 trillion.
The residual of Rmb 3.2 trillion is assigned to depreciation. China invested Rmb27 trillion between 2001 and 2005. The total capital stock for productive purposes is probably over Rmb50 trillion now. On this basis, Rmb3.2 trillion of depreciation would represent about 6% of the productive capital stock. Considering how low the returns on capital are on most investments, 6% seems a reasonable level.
The above estimates are really one man’s efforts. The true data could be off by 5% or even more. However, considering the opaque state of affairs, I think it is better than nothing.
The Growth Gap from Overcapacity
China may have over-invested in manufacturing, electricity generation, highways, ports, and property. These sectors accounted for about three-quarters of growth and 60% of total fixed investment in 2005. Under normal circumstances, overcapacity would lead to price and profit decline, which triggers investment decline. However, as local governments have strong influence over investment funding and are motivated by growing GDP at any cost, overcapacity may cause fixed investment stagnation but not decline.
Stagnation of investment in sectors with overcapacity could still have a serious effect on GDP growth. I estimate that growth of investment in such industries accounted for 40-50% of demand growth in 2005. Without acceleration in other GDP components, China’s economy could experience a significant slowdown, deflationary pressure, and a surging trade surplus.
Various ideas are being mooted as to how to sustain high GDP growth. I discuss three popular ideas below.
Pump-Priming Again
The government’s finances have improved tremendously; the fiscal balance bottomed at 2.6% of GDP in deficit in 2002 and was probably balanced in 2005. The actual improvement is much bigger. Many previously outstanding arrears, such as VAT rebates for imported components and equipment for export production, have been paid off. Fiscal incentives for purchase of domestic equipment have been increased. In short, China is in a good position to engage in fiscal stimulus.
Because personal income tax is quite small in China’s tax revenue (direct taxes such as VAT, business tax, and tariffs account for 63% of tax revenue), cutting tax does not stimulate the economy effectively. ‘Borrow and spend’ could be effective, however.
Increasing infrastructure spending is the policy suggestion that I have heard most. However, it won’t be easy technically. The transportation sector accounts for 40% of infrastructure investment and is already experiencing overcapacity. The container ports, for example, are headed for overcapacity on existing projects, despite rapid trade growth. China already adds more highways every two years than Japan has in total. The utilization rate of highways is low in most provinces. Even the railroads are not as underinvested as many believe. The coal-shipping bottleneck has eased and is likely to be solved for good once the three dedicated rail lines under construction are completed.
The electricity sector has accounted for 90% of investment growth in the utilities sector. According to the National Statistics Bureau, installed capacity reached 500 GW by end 2005, with 300 GW under construction. The amount of capacity under construction is similar to the total capacity in the UK, France, and Germany combined. This sector is headed for a prolonged period of overcapacity, in my view.
Gas and water distribution seem to deserve more investment. These sectors accounted for 1% of total fixed investment in 2005. 3G could increase telecom investment. This sector is less than 2% of total fixed investment. Similarly, rail, at about 1% of total fixed investment, may deserve more investment. These three sectors totalled 4% of total fixed investment. A push there could ease the decelerating trend, but would hardly reverse it.
Second Wind for Property?
Stimulating property is the hottest macro idea in the market at present. The cement and steel industries have massive overcapacity. Property construction needs both. Wouldn’t it be smart to stimulate property again?
Property has become a vast industry that involves all local governments, tens of thousands of property developers, thousands of construction companies, banks, and tens of thousands of materials suppliers. The government reported 18.6% growth in property under construction in November 2005. If that growth rate continued into December, total property under construction would be 1,666 million sq m.
At Rmb 2,759/sq m (the official average selling price in November 2005), the total market value of property under construction would thus be Rmb 4.6 trillion – or 25% of revised-up 2005 GDP.
The property data are not reliable. Local governments have incentives to skew the data in their favor in relation to the central government and potential buyers. The overwhelming incentive is to underreport volume under construction to boost price expectations. It is obvious that property is not selling well in some key cities. But, local officials still report brisk sales. Hence, volume under construction is probably considerably understated.
Understating average selling prices has also become widespread, as the central government has shown displeasure at skyrocketing prices that upset people. However, to entice potential buyers, local governments and property developers must project a picture of skyrocketing prices. This is why the media under the control of local governments or property developers report sensational stories about price rises while the government statistics show low and stable average selling prices.
I would not be surprised if the properties under construction were worth 35% of GDP if all the data were properly adjusted. Even levels of around 25% are associated with economies that subsequently experienced big problems (e.g. Thailand in 1997).
The average selling price of an 80 sq m flat is 8 times average urban household income, on my estimates. In some hot cities, the ratio is as high as 12 times. While such high prices are not unheard of (about 8 times in Hong Kong), the combination of such high prices and high volumes has never happened before. If we take the official data, China was building 1,290 mn sq m of residential properties or about 16 million flats at the end of 2005. That is about 10% of urban households.
The government data still show strong sales of properties. Because this is such a fragmented industry, it is impossible to verify the data. However, it is easy to see the empty buildings in so many cities. In the western cities, the situation is even worse than in the coastal region, I believe.
If China wants to give property a second wind, it could cut mortgage interest rates. China’s mortgages are all floating rate. The interest rate of 5.5% is 3.25% higher than the one-year deposit rate. This sort of spread for mortgage products is unheard of elsewhere. It would seem reasonable to cut mortgage interest rates by one percentage point.
Such a policy decision would certainly lift the property industry, mainly through reviving speculation rather than genuine final demand, I believe. For final demand, the disconnect between price levels and income is the main issue.
Further, it would lead to another wave of borrowing for land speculation. Land purchases have exceeded land under development massively in the last few years. I estimate that purchased land not developed could total 725 mn sq m, 3.6 times the land that went into development in 2005. Anecdotal evidence suggests that land flipping is widespread. Cutting mortgage rates could lead to another wave of bad debts, in my view.
If 725 mn sq m land does go into development, and 80% of it is for residential property, this could result in 25 million more flats. Together with the 16 million already under construction, 41 million flats would be equal to 25% of urban households. We do not know how many sold flats are empty, but a figure of 5 million wouldn’t surprise me.
In my view, giving property a second wind is just an excuse to turn bank loans into revenues for local governments and profits for speculators and leave a wave of bad debts behind for the Chinese population. I am not ruling it out, though. Vested interests may be powerful enough to bring about such a policy shift.
Lifting Consumption
Shifting to a consumption-led growth model has been China’s dream for ten years. The reality, I believe, is that consumption declined to around 50% of GDP in 2005 from 65% in 1995, after taking into account the GDP revisions. There are many technical reasons why China’s consumption is relatively weak. The main political factor is that the Chinese government is too powerful in the economy and too interested in mobilizing resources to invest to show progress.
The household savings rate is about 30%, on my estimates. This is high by international standards, but cannot explain China’s low consumption level. The low share of household income in GDP (56%) could be a more important factor. To boost consumption, then, the government needs to increase household income.
I think the most effective way is to securitize government-owned assets and distribute them among the population. Currently, monetizing natural resources such as coal, oil and land creates income that goes immediately into investment through government-controlled channels. Were these assets owned by the broader population, they could decide how much to consume and how much to save. Such a policy could lead to multi-year consumption boom, in my view.
However, in the past few years, powerful vested interests have emerged to take advantage of government-controlled assets, making pro-consumption reforms difficult. This is why I am not optimistic that China can shift to consumption-led growth.
Declining cyclical savings could naturally lead to a higher share of consumption in GDP. During an economic boom, the prices of natural resources (e.g., coal, oil, and land) surge, which is a tax on household income and shifts money to businesses and government, which are more interested in investment. When the cycle cools and the prices of natural resources decline, the process reverses and household income’s share in GDP rises. Consumption’s share in GDP also rises naturally. However, this sort of cyclical fluctuation does not signal any change in China’s development model.
China Steelmaking Capacity Balloons
Global Industry Group Fears
Buildup Could Hurt Prices
Despite Growth in Demand
By PAUL GLADER
Staff Reporter of THE WALL STREET JOURNAL
October 4, 2005; Page A6
SEOUL -- World steel industry leaders are worried that mounting overcapacity in China could push down steel prices at some point, despite continued steady demand growth for their products world-wide.
"In coming years, there will be massive, massive excess capacity" in China, said Nicholas Lardy, an expert on China and a senior fellow at the Institute for International Economics in Washington, in a speech to a group of steel industry executives at the International Iron and Steel Institute annual meeting, which is being held in South Korea this week.
China added about 50 million metric tons of steelmaking capacity in 2004 and will add more than that in 2005, taking that country's annual steelmaking capacity to roughly 400 million tons, according to Mr. Lardy. That is enough to meet the country's annual demand until 2015, he said. Mr. Lardy said government efforts in China to consolidate steel capacity and limit expansion could take longer than expected, largely because of resistance from Chinese provincial governments that seek to foster local steelmakers.
![[Chart]](http://online.wsj.com/public/resources/images/NA-AG524_steel10032005171755.gif)
The Chinese buildup comes at a time when producers have stumbled in efforts to curb capacity growth elsewhere in the world by cutting back on subsidies paid by governments. Talks at the Organization for Economic Cooperation and Development in Paris aimed at ending state subsidies have fallen apart as trade representatives couldn't agree upon how to implement changes. "These [talks] are not likely to restart in the near future," said Ian Christmas, secretary general of the IISI. "We believe it is still a real issue that, at some stage, if we want a competitive dynamic and open business, we have to address."
In addition to China, steel companies also are grappling with lofty prices for raw materials and energy and face growing competition from rival materials such as plastics, aluminum and cement in key markets such as automotive and containers. And yet, the industry is also enjoying one of its strongest periods of prices and profits as the result of a global commodity boom.
"We are in a very prosperous industry and we believe the outlook for next year is very positive," said Mr. Christmas. "We are not saying it is all gloom and doom. We are saying there are risks and dangers going forward."
Mr. Christmas criticized the world's three largest iron ore companies -- Brazilian mining giant Companhia Vale do Rio Doce, or CVRD, Rio Tinto and BHP Billiton -- for having a natural monopoly with 70% market share for iron ore shipped across the oceans. Steelmakers use iron ore as an ingredient to melt in their furnaces, mixing it with other materials, to create steel.
"Their current market behavior could be a threat to the long-term competitive position of steel," said Mr. Christmas. He and other executives said the organization doesn't plan to raise anticompetitive issues against the iron ore industry at international trade bodies. Instead, he said, steel companies and others are seeking to buy up iron ore mines and bring more iron ore into supply. Mittal Steel Co. of the Netherlands, for example, is pursuing iron ore mines in Liberia.
The IISI estimates steel demand in 2005 stands at 998 million metric tons, up 3% globally from 2004. It expects demand to grow even more in 2006 with an estimated 1.04 billion tons consumed, up 4% or 5% from 2005.
Prices Fall in Manhattan As Housing Market Cools
By DANIELLE REED
DOW JONES NEWSWIRES
October 4, 2005 12:44 p.m.
NEW YORK -- Housing market watchers can exhale. Prices in some of the nation's hottest markets are at least leveling off, and in some cases even coming down.
In New York, a report prepared by appraisal company Miller Samuel Inc. on behalf of real estate firm Prudential Douglas Elliman released Tuesday showed that average Manhattan apartment prices fell nearly 13% in the third quarter 2005 to $1.15 million from $1.32 million in the second quarter.
Housing stock is also staying on the market longer, the report showed, with the number of days it takes to sell an apartment increasing a month to 133 days from 102 days.
The report was confirmed by other research, including reports from two other real estate firms, Brown Harris Stevens and Halstead Property. These showed that average apartment prices in Manhattan were down 11% in the third quarter for co-ops to $1.04 million from $1.17 million in the second quarter, and down 10% for condominiums to $1.28 million from $1.42 million in the previous quarter.
Data released earlier in the week by real estate appraisal firm Mitchell, Maxwell & Jackson Inc. showed that average Manhattan apartment prices for co-ops and condos south of 96th Street fell 3.9% to $1.09 million, the first time in two years the firm had seen a drop in prices. The decline followed a drop in overall demand, according to Mitchell, Maxwell & Jackson managing director Michael Martin, as the number of sales dropped 33% to 1,031 from 1,528.
The Prudential Douglas Elliman report also showed a decline in sales, albeit more modest. In the third quarter, the number of sales dropped 8.4% to 1,997 from the prior quarter's total of 2,181, "as mixed economic news weakened demand," the firm said in a press release.
Not Just New York
The apparent slowing in the New York housing market followed signs of cooling off in markets across the country. The most recent national data have been mixed, while reports from specific West Coast markets have been pointing to a possible slowing of demand.
New home sales reported last week fell 9.9% to a seasonally adjusted rate of 1.24 million units in August, according to the Commerce Department. But the pace of existing home sales rose 2% in August to 7.29 million units, a near-record pace, according to the National Association of Realtors.
In San Francisco, the number of homes sold in August dropped 9.9% to 662 from 735 sold in the same month a year ago, though median prices still climbed a healthy 11.5% to $745,000, according to DataQuick Information Systems. In San Diego, the number of homes sold dropped 3.6% to 5,379 from 5,580 a year earlier, and the median price rose just 2.1% to $493,000.
With home prices appreciating routinely at a double digit pace for a couple of years in certain metropolitan markets, analysts have long predicted a slowdown would eventually take hold. In New York, prices "are going to reach a level that just can't be sustained," said Mr. Martin, the managing director at Mitchell, Maxwell & Jackson.
Particularly with short and long-term interest rates heading higher, affordability may start to make buyers more resistant to high prices in the coming months, he said, at least in the under-$2 million market where buyers are more sensitive to changes in interest rates.
But so far, Mr. Martin said he doesn't see signs of a bubble bursting. More likely, he said, there will be "a soft landing," in which prices ease up a bit and then level off for a time.
日民間企業平均薪資連續7年減少
日本的國稅廳根據去年所得稅繳納情形調查了在民間企業工作的人的平均薪資,結果發現民間企業平均年所得為438萬8000日圓(約台幣131萬6400元),較前一年下滑了5萬5000日圓(約台幣1萬6500元),已是連續7年的減少。
而去年一年在日本民間企業工作賺取所得的工作者數,也較前一年少了13萬人(0.3%)來到4453萬人,整體薪資總額也較前一年減少了2兆8529 億日圓(1.4%),來到195兆4110億日圓,這個數字也是連續7年減少。
之所以會減少,依國稅廳的評估,主要是因為換工作的人增加,且改變企業雇用型態從正職改為兼職或是打工的企業增加,是構成平均薪資減少的主要原因。
而平均薪資再細分的話,可分為薪資、津貼和獎金兩個部分,薪資、津貼的部分也是下滑了1.0%,來到370萬1000日圓(約台幣111萬300 元),而獎金的部分則是下滑2.0%,來到68萬7000日圓(約台幣20萬6100元)。
再依男女別來看的話,男性的平均薪資是540萬9000日圓(約台幣162萬2700元),較前一年下滑了3萬3000日圓(約台幣9900元);而 女性的平均薪資則是273萬6000日圓(約台幣82萬800元),較前一年減少了1萬2000元(約台幣3600元)。
在民間企業的薪資持續下降的情況下,政府財政泉源的所得稅額是8兆7988億日圓,比前一年還增加了3339億日圓(3.9%),是4年來首度反轉上 升,主要原因是從去年開始,所得稅的配偶特別扣除額部分廢止了的影響。所以整體看來,雖然大家都口口聲聲地說日本景氣在復甦,但是事實上還沒有反應到上班 族的薪水及荷包,而且還因政府的稅制改變,繳了更多的稅。
(2005/9/29)
美國市場掀起液晶電視「超低價」行銷戰
台灣日本綜合研究所副所長
林武雄 從今 年開始,美國的液晶電視市場販賣台數是明顯地增加,其中成長最快的當推「Western House」、「Magnavox」、「Polaroid」等三個品牌。這三個品牌的市佔率在年初就達到10%,同時每月都呈現快速的成長、可謂來勢洶 洶。至今年6月底,全美地區已突破30%的市佔率。
根據調查指出,這三家品牌「人氣」走紅的理由在於「低價位」。就以26吋液晶電視而言,Sharp、三星等名牌的商品店頭售價是1500美元左右,但前 面所言三種品牌相同尺寸的商品卻便宜四成。在量販店Circuit City較年長店員推薦的理由是:「Polaroid的液晶電視畫質不輸Sharp和SONY,但價格便宜、品質又好。」年輕的店員則是推薦 Magnavox液晶電視。據量販店Best Buy店員的分析指出:「買Sharp、SONY、Sansung都是高所得的中高年消費者,而買Western House等品牌則是傾向年輕顧客居多。」據調查公司Displaysearch 在9月1日(2005年)發表,大型液晶電視(10吋以上)價格下滑現象,已出現止跌回升。液晶電視價格下滑,對家電廠商的業績無疑是沈重壓力。
在美國,這三個品牌在家電和照相機領域過去都極富盛名,曾幾何時出現經營困難,先後走上被併購的命運。其中,Magnavox是賣給荷蘭的家電大廠 Phlips、Western House是被台灣奇美併購、2001年Polaroid倒閉後併入美國投資公司的集團內。併購的理由是:「這些品牌在美國有相當的知名度,有利於對美國 市場的行銷。」Phlips在美國擁有高知名度,但Magnavox在美國市場卻是以低價位行銷聞名;Western House的液晶電視是由台灣奇美集團所生產;Polaroid的產品是由中國大陸家電廠商生產;它們的行銷策略就是販賣低價位商品來奪取市場,過去的成 功經驗又再度運用到液晶電視的市場行銷上。
「低價位」取向品牌的興起在美國是見怪不怪。美國的消費者非常重視價格取向的行銷模式。過去,映像管電視、DVD和電腦都受到低價位品牌席捲市場。據高 盛證券家電部門專家的分析指出:「液晶電視和其他家電製品同樣都是低價位品牌抬頭,但來勢洶洶卻在預料之外。」「低價位」品牌急速崛起是數位家電的特性, 也是宿命。液晶電視的構造和電腦液晶螢幕極相近,它是經由面板和影像處理晶片的零件組裝就能成為產品,再加上亞洲國家也擁有這項技術。因此,盡管是美國的 品牌,沒有品質光是低價位要行銷也難。例如Western House等品牌的液晶電視在美國販賣,但實際製品的製造技術是由中國和台灣廠商所提供。
在美國市場一枝獨秀的Sharp,去年擁有30%的市佔率,但今年春天卻降到20%,市佔率和Magnavox已不分軒輊。Sharp濱野稔重專務說: 「跟低價位品牌進行對抗,無異於陷入價格戰的泥沼,我們將另起爐灶。」於是,Sharp重新擬定戰略,不再搶攻20~30吋中型市場,而以30~40吋大 型液晶電視為市場的普及目標。其他日系廠商也東施效顰,採取同樣策略。理由是畫面愈大愈能表現出畫質的差距,而畫質的處理技術又是日系廠商的不傳手藝。
目前美國超薄電視市場還有一個令人矚目的地方,那就是起居室、客廳的電視機市場王座爭霸戰。美國是以大畫面為主流,既使是超薄家用電視的主戰場還是在 40吋以上大型畫面。市場的主角是以超大型內投式電視機(Rear Projector TV)見長的SONY和松下的電漿電視。如今,兩雄對決、烽火四起;40吋大型內投式電視一直是雄霸美國電視機市場。過去,映像管技術是主流。自2000 年以來,採用最尖端零組件的MD(Micro Display)方式新型超大內投式電視機推出市場;主要是40吋以上大型畫面電視在畫質和節省空間上,獲得了突破性的改良,價格上也為消費者接受,因此 市場呈現爆發性的成長。
無疑地,電漿電視已威脅到內投式電視機的市場,銷售業績來勢洶洶、成長亮麗。電漿電視推出之初價格偏高,但松下大幅的降價後和MD內投電視機的價格差距 縮小。現在SD型(標準畫質)電漿電視42吋價格是低於2000美元,因此急速地侵蝕到MD的市場;2005年9月3日,Sharp町田社長說:「要檢討 內投式電視機從市場撤退」。Sharp是世界上最大的液晶電視機製造廠商,但Sharp在美國販賣內投式電視機(Rear Projector)的市場佔有率還不到5%。
在美國市場內投式電視機擁有40%的SONY,已面臨到一股危機感。SONY電視機市場頻頻失守,美國MD內投式電視機市場可算是最後的一座堡壘。據說 今年夏天,SONY預定推出低於2000美元的新產品投入市場,以背水一戰的決心來跟松下一決勝負;最近松下也發表,預定在11月推出65吋新型電漿電 視,年產12000台,店頭價格設定在99萬日幣。首次採用世界最先進的Hi-Vision播放系統,畫面影像細緻、畫質清晰逼真,同時畫質也大幅提升。 松下以一貫生產做武器、徹底削減商品原價、設定讓市場震撼的價格,來對抗低價位液晶電視的威脅。
據美國Displaysearch在8月18日(2005年)的發表:「05年第二季世界電視機佔有率調查結果」。映像管、超薄電視合計總額,SONY 市佔率8.8%,名次從第一位退居為第三,三星躍居第一、市佔率9.9%。SONY超薄型電視因市場對應失策,痛失王座、地位動搖。松下位居第三,但電漿 電視在市場還是穩居龍頭地位。
參考資料:
(1) 渡邊清治、高木あやか「猛威振るう激安〝ブランド〞」,2005.9.3週刊東洋經濟,頁20~21。
(2) 「リアプロ、プラズマの霸權爭い過熱」,2005.9.3週刊東洋經濟,頁21。
(3) 「シャープ、リアプロジェクションTVから撤退の可能性」http: //news.goo.ne.jp/news/reuters/keizai/20050905/JAPAN-186699.html
(4) 「液晶:大型価格、1年ぶりに下げ止まる」http: //news.goo.ne.jp/news/infostand/it/20050905/1401242.html
(5) 「テレビ世界シェア:サムスンが初の首位、ソニーは3位転落」http: //news.goo.ne.jp/news/infostand/it/20050822/1399515.html
(6) 「松下、キヤノン 薄型TV価格競争激化」 http://news.goo.ne.jp/news/sankei/keizai/20050826/m20050826015.html
(7) 「松下、65型の高品位対応プラズマテレビを11月発売」 http://news.goo.ne.jp/news/reuters/keizai/20050825/JAPAN-185696.html
A Place in the Sun
By ERIC J. SAVITZ
SUNSHINE IS FREE. That simple fact is what gives the solar-power business so much allure. You don't have to extract it from the ground, it's not subject to embargos, it's nonpolluting and if the supply ever ran out, we'd have a bigger problem than high gasoline prices. On the surface, at least, it certainly seems like an obvious way to address some of the economy's ongoing energy problems.
It's also well understood: America has been tinkering with solar power for decades. In a symbolic act during the 1979 energy crisis, Jimmy Carter installed solar panels on the roof of the White House. (He also urged us to wear more sweaters.) But as the crisis faded, so did interest in solar. After Ronald Reagan and his brown suits moved into 1600 Pennsylvania Ave., the White House solar panels were removed -- and solar power resumed its previous position as a technology considered more suitable for calculators and pool heaters than powering the grid.
But with talk growing of a new energy crisis, thanks to record prices for crude oil and gasoline, solar companies have been attracting renewed attention. Michael Rogol, an analyst with CLSA Asia-Pacific Markets who tracks the global solar market, says the stocks in the sector are up about 150% over the past 12 months. Wall Street is ramping up to slake the thirst for solar stocks with more supply: SunPower, a subsidiary of chip-maker Cypress Semiconductor, has filed to come public, as has Q-Cells, a large, fast-growing German solar-cell company that Rogol calls "the Netscape of the solar sector." Another large player, Norway's Renewable Energy Corp., or REC, has also said it plans an IPO.
Encouraged by this new enthusiasm for the sector in the public markets, venture capitalists have been funding a steadily increasing number of solar-related start- ups, sinking more than $100 million into new solar companies in the first half of 2005. (See table: The Next Generation.) The recently passed energy bill provides some modest incentives for solar power, and many states have installed solar-friendly tax incentives of their own.
While solar represents a tiny percentage of global power generation, it is growing rapidly. Worldwide, solar power production this year should reach 1.5 gigawatts, double the 2003 level. By 2010, according to CLSA, the total should quadruple to six gigawatts. Industrywide revenue, the firm predicts, will grow from $11 billion this year to $36 billion in 2010.
Now that's some nice, Google-style growth. But investing in the sector isn't easy. Many of the biggest producers of solar cells are actually divisions of much larger companies -- BP, Sharp, Shell, General Electric -- that you'd hardly consider pure plays. And most of the more focused solar companies, with a few exceptions, are still private or trade outside the U.S.
Meanwhile, just as demand seems poised to take off, the solar industry finds itself grappling with a shortage of polysilicon, the raw material used to create both silicon cells and semiconductors. At least for the next few years, the industry's growth rate will be muffled not by any shortage of demand, but rather by insufficient supply. In all, finding good investments will require ingenuity.
The basic idea of solar power is simple. Energy from the sun strikes a silicon panel, releasing electrons and creating electricity. Those panels are connected together in modules, which can provide power standing alone or hooked into the electrical grid. One of the standard, but magical, pitches made by solar equipment providers is the image of your electricity meter running backwards: When the sun is shining and demand for power is high, you can be selling power back to the grid, while others buy it.
![[Sun]](http://online.barrons.com/public/resources/images/b-solar_f309162005164911.jpg)
The Bottom Line: Though solar stocks have surged over the past year or so, some could rise further. Some analysts think MEMC, the largest-capitalization play on solar, could jump another 50%.
|
|
What's not so simple is the economics of solar power. For starters, while the sun's energy is abundant, it isn't available 24/7. (You may be familiar with a fascinating natural phenomenon known as "night," and another frequent but less predictable factor called "clouds.") Ergo, solar power is more practical in some places than others. Also, silicon panels are rather inefficient: Most of the potential energy in sunshine is lost. So to create meaningful amounts of electricity from solar panels, you need lots of them.
The good news is that as the industry has grown, the retail cost of solar energy has dropped an average of 6%-7% a year for the past 15 years, says Rhone Resch, director of the Solar Energy Industries Association, a trade group. Within 10 years, Resch says, solar should reach parity with the average retail electricity price.
"This is not your grandpa's solar," says Ron Pernick, the principal of Clean Edge, a Portland, Ore.-based research firm. He figures the costs of production have been dropping about 18% for every doubling of output -- and output is doubling every two or three years. Still, the industry isn't at parity yet. Resch says solar power, at 22-23 cents per kilowatt, costs about twice as much as the average retail price of electricity in the U.S.
Keep in mind, too, that installing a solar system requires a large upfront capital investment that may require some creative financing. Putting a solar system on your roof with enough cells to run your house could set you back $25,000-$30,000. You do get to lock in costs, though: Resch likens it to buying a car and paying for 25 or 30 years of gasoline upfront.
One small company, Sun Edison, has set up an intriguing scheme where it places solar systems on the flat roof of a supermarket or big-box retailer, then sells the power back to them. The equipment itself is owned by an investor -- in each of the four installations they've completed, it's Goldman Sachs -- which benefits from tax incentive programs. Sun Edison's payoff comes years from now as it gradually buys back the equity and associated income in the equipment.
Fortunately for the solar-power industry, a number of state and national governments have decided that there is a public good in developing alternatives to fossil-fuel based energy production, and have installed lucrative subsidy programs designed to overcome the cost differential.
The most substantial incentives have been offered by Japan and Germany. While neither country is among the world's sunnier climes, both have become the global leaders in solar power. So it should be no surprise that many of the more successful publicly held solar companies are traded in Frankfurt or Tokyo, not New York. (See table: Sunny Prospects)
For domestic solar advocates, that situation is a source of no little frustration. "Our resources are orders of magnitude better," sighs the trade group's Resch. "But Germany has created the best incentives in the world." Germany's policy, designed to reduce the country's reliance on fossil fuels, provides a fixed payout of about 54 cents per kilowatt hour for as much power as you can produce.
Rick Feldt, CEO of Evergreen Solar, a Marlboro, Mass., solar-cell company, complains that the incentives in the recently passed federal energy bill provides little help. He notes that the bill offers only two years of tax credits, with no assurances after that -- not enough to get manufacturers to commit investment capital in the business.
In the U.S., the industry suffered a blow recently from the demise of California Gov. Arnold Schwarzenegger's so-called Million Solar Roofs initiative, which would have provided substantial incentives in the nation's largest state for both residential and commercial buildings. Though the measure passed easily in the state Senate, it fizzled after the governor threatened a veto over amendments to the bill in the state Assembly that would have required solar-installation work to be handled by licensed electricians at the prevailing union wage rate. The governor lately has talked about stepping around the legislature via the adoption of similar incentives through the state's Public Utility Commission.
WHILE THE STATUS OF THE CALIFORNIA MEASURE is important, the talk of the solar industry is the ongoing shortage of polysilicon, the raw stuff used to manufacture photovoltaic cells. For many years, the only real use for that particular material was to make silicon wafers for the semiconductor industry; the solar industry's needs were minimal. But not anymore.
Thanks in no small measure to the incentive programs in Germany and Japan, solar-cell demand has expanded 40% or more for several years running, versus 20%-25% in the past. The result is that by 2006 almost half of the world's polysilicon supply will be soaked up by the solar-cell makers. Richard Winegarner, proprietor of consulting firm Sage Concepts, says the market is about 10% short this year, with the solar-cell industry, and not chip makers, absorbing most of the resultant pain.
"I can't find a data point anywhere that shows anything other than a very real shortage of polysilicon that is going to get worse over the next two or three years," says Paul Leming, an analyst with Princeton Tech Research. "It would take a solar-panel market collapse to bring any slack capacity to the polysilicon business any- time soon."
Not surprisingly, polysilicon prices have soared: Winegarner says contract pricing has moved from about $32 a kilogram to $45 since 2003. Spot pricing, depending on whom you ask, is running $60-$80 a kilogram, though Winegarner notes that there is "essentially no volume" in the spot market. "The industry has already wrung out every nook and cranny of inventory and scrap," he says.
The world's polysilicon makers are working frantically to add capacity, but supply is unlikely to catch up for a while. Optimists think the shortage could be cured by 2007. Neil Gayle, coordinator of the Critical Materials Council of Sematech, a chip-industry consortium, thinks there could be shortages though 2009.
The bottom line is that there won't be enough solar cells to meet demand for at least the next several years, potentially triggering a supply crisis for some smaller players that lack contractual supply arrangements with polysilicon producers.
The chip industry has expressed its own concerns about the potential for the shortage to slow the electronics business. But this is a lot bigger problem for solar-cell companies than for the chip industry: While silicon represents less than 1% of the cost of semiconductor products, they account for more than 30% of the raw-material costs for solar cells. A doubling of silicon pricing wouldn't mean much for chip makers, but it would be a big problem for the solar business, which must hold down costs to compete with conventional power.
The obvious play on the polysilicon shortage is MEMC Electronic Materials (ticker: WFR), a St. Peters, Mo., company that is one of the world's largest producers of silicon wafers. Unlike some of its rivals, MEMC produces most of its own silicon feedstock, and in fact sells some excess supply back into the market. The result is that MEMC benefits from soaring wafer pricing without suffering the associated increase in raw-material pricing. MEMC shares have doubled over the past year, to a recent $19.79, boosting the company's market capitalization to about $4 billion. That makes MEMC the largest-cap play on solar growth.
And there may still be some juice left in MEMC shares. Leming of Princeton Tech Research thinks the stock could move up another 50%, and says he can "sketch a scenario where it can double or triple from here," noting that the company trades for only about 12 times expected 2006 earnings of $1.56 a share. Profits at that level would be up 39% from an expected $1.12 a share this year. And this, by the way, is for a company that does not yet do much direct business with the solar industry. Leming thinks MEMC could eventually cut a deal with solar-panel makers to provide dedicated wafer supplies. If so, Lemming says, the growth could lift the stock to $50.
MEMC ranks fourth in the world in polysilicon capacity, behind Hemlock Semiconductor, which is partially owned by Dow Corning. Third on the list is the other potential wafer investment, Japan-based Tokuyama. Also in the top five are Wacker Chemie, a privately held German chemical conglomerate, and Advanced Silicon Materials, which was recently sold by Japan's Komatsu Electronic Metals to Renewable Energy Corp., the Norwegian solar-panel maker. The purchase of Advanced Silicon by REC, which as noted is planning an IPO, assures the company of sufficient silicon supplies.
Then there's SunPower, the Cypress subsidiary now in registration to come public. It is losing gobs of money -- for the first half of this year, it lost $13.6 million on revenues of $27.3 million. But the company is attracting considerable interest for its highly efficient solar cells: The company claims in its SEC filings that it generates up to 50% more power per unit of area than conventional cells. In an industry where driving costs lower is a key to long-term success, SunPower should attract eager buyers.
The only current domestic pure-play solar option is Evergreen Solar (ESLR) of Marlboro, Mass. -- and it has some similar attractions. Evergreen shares have increased sixfold over the past 18 months. The company uses a novel process for generating solar cells that it claims uses 35% less silicon than conventional manufacturing processes. That should give Evergreen an edge in the race to reduce costs. And CEO Rick Feldt says the company has a pilot project that would cut the silicon used per wafer by another 50%.
WHILE CERTAINLY THE STREET IS ENAMORED of Evergreen's technology, analysts are equally enthused about its joint venture with Germany's Q-Cells. The two companies are building a new solar-cell manufacturing plant near Q-Cells' headquarters in Thalheim, in eastern Germany. The plant will dramatically increase Evergreen's capacity, adding 30 megawatts of cell production to the 15 megawatts it can produce at its own factory in Massachusetts. Feldt thinks the German plant will be far more efficient than the company's domestic plant, perhaps generating $100 million a year in revenue with gross margins of 30%-35%. Assuming the plant comes on stream as expected, Feldt says, the company should turn profitable on a run-rate basis sometime in 2006.
Moreover, Feldt says that if the German venture is successful, the partners would increase their production to as much as 120 megawatts. And if that happens, he says, the joint venture could add additional capacity in other locations. If that all plays out, says J. Michael Horwitz, an analyst at Pacific Growth Equities, "it could be one of the better stocks in 2006." And if the German project has problems? Then so will the stock.
CLSA's Michael Rogol, a big Evergreen fan, in a report earlier this year, listed a total of 15 solar stocks to buy. Many are outside the U.S.: Kyocera, Sharp and Sekisui Chemical of Japan; Thailand-based Solartron; Motech of Taiwan; Carmanah and ATS in Canada; and Germany's Conergy and SolarWorld.
The global range is a reflection of the fact that, unlike oil or gas or coal, producing energy from the sun is about creative engineering and -- at least for the moment -- bold government policy, not geographic advantage. No one is going to discover a new source of sunlight, but it's possible to figure out better ways to use it. Anyone can get in the game. Even America.
Tasty Outlook
Barron, By ANDREW BARY
ASSET-RICH NESTLÉ IS STARTING TO ATTRACT greater U.S. investor interest, due to the strength of its global food business, an increasingly shareholder-oriented management and the huge combined value of its stakes in Alcon, the world's top eye-care company, and international cosmetics colossus L'Oréal. Nestlé's U.S.-listed shares (ticker: NSRGY) have risen 9%, to 72, this year, but they still could have significant upside because the Swiss giant is a bargain relative to other major food companies when its Alcon (ACL) and L'Oréal (12032.FR) stakes are stripped out. This makes Nestlé an attractive sum-of-the-parts story. - The shares trade for a moderate 17 times projected 2005 profits of $4.15, but Nestlé's 2005 price-earnings ratio is just 12.7, excluding the market value and earnings contribution of its Alcon and L'Oréal holdings. That's a cheap price for the world's largest and, arguably, best-positioned food company. Nestlé has exposure to fast-growing products like bottled water, pet food and ice cream, as well as the industry's most extensive presence in the developing world, where the growth outlook is better than in the mature Western Europe or U.S. markets. Nestlé gets almost 30% of its sales in Latin America, Asia and Africa. Nestlé's 2005 P/E, adjusted for Alcon and L'Oréal, is much lower than the average multiple of 16 for major U.S. food stocks like Kraft (KFT), General Mills (GIS) and Kellogg (K). The American depositary shares of France's Groupe Danone (DA), meanwhile, at their recent price around 22, have risen 21% this year and fetch a rich 22 times estimated 2005 net income amid continued speculation that PepsiCo is interested in buying the company.
The global food industry clearly faces challenges, including the growth of discount retailers in the U.S. and Europe, the rising popularity of private-label brands, limited pricing power, the trend toward eating away from home, as well as rising commodity and packaging costs. Food tastes differ widely around the world, making it difficult for companies to develop truly global brands. Among the limited number of goods with worldwide appeal are coffee, chocolate, soda, scotch and cigarettes. Food remains one of the most fragmented businesses in the world. Nestlé's No. 1 position and $74 billion in annual sales translates into just a 2% share.
Highlighting the troubles in the food business are the struggles of Kraft, General Mills and Campbell Soup (CPB) to generate growth in both sales volume and profits. Kraft stock, at 31, is back where it stood at its initial public offering in 2001.
Nestlé has performed well since chief executive Peter Brabeck, 61, took over in 1997: The Vevey, Switzerland-based company has delivered 5.7% organic revenue growth -- 7%-plus, if acquisitions are included. That's impressive by the food industry's slow-growth standards. Nestlé shares have doubled since 1997, but haven't risen much in recent years.
Bulls are betting that Nestlé will hit its goal of 5% to 6% annual organic revenue growth, which could translate into yearly profit gains around 10%, based on a widening in Nestlé's profit margin, now at 12%, and share buybacks. During the first half of 2005, organic revenue growth was 5.2% and earnings were $2 a share, up 11% from the level in the same period a year ago. The company also pays out about 40% of profits in dividends, and typically lifts payouts annually. The current yield is 2.2%.
Several analysts covering the 139-year-old Nestlé see modest upside potential of 10% to 15% in the next 12 months. The appreciation could be much greater over the next few years if Nestlé's financial performance stays strong and its story becomes more widely known.
Andrew Wood, a Sanford Bernstein analyst, has come up with a sum-of-the-parts value on Nestlé of around 480 Swiss francs per share, or $95 for the U.S.-listed shares. The Swiss shares traded Friday at 367 Swiss francs. Each U.S. share equals a quarter of a Swiss share.
Nestlé's fans like what they see in its food business and its not-so-hidden other assets. "We used to see Nestlé as a slow-moving animal that was less concerned with driving profitability than in getting bigger," says David Herro, manager of the Oakmark International Fund, a Nestlé holder. "Quietly, and somewhat masked by currency swings, there has been a change in emphasis to running top-notch businesses focused on returns, not on size," says Herro. He maintains that the shares could rise at least 50% over the next few years.
Nestlé offers a hedge against a weakening dollar, because its underlying shares are denominated in Swiss francs, historically one of the world's strongest currencies. The downside: A stronger franc crimps reported revenue and profit growth. This happened last year when the dollar weakened.
MEANWHILE, "NESTLÉ'S MANAGEMENT ACTS as if it were a family company. They look out generationally," says Thomas Russo, a partner at Gardner, Russo and Gardner, a Lancaster, Pa., investment firm that has a position in Nestlé. Russo happily notes that Brabeck talks about an investment time horizon of 35 years.
Russo also points to Nestlé's success in China, where it has $1 billion in annual sales and is the largest foreign food company. Overall, Nestlé's sales dwarf those of its rivals. Kraft, the No. 1 U.S. food maker, probably will have 2005 sales of $33 billion, less than half Nestlé's.
The Swiss company's scale is enormous. It operates in more than 100 countries, runs 500 factories and employs 247,000 people. Its products include Stouffer's frozen foods, Nescafé coffee, Dreyer's and Häagen Dazs ice cream, plus Poland Spring, Perrier and San Pellegrino water. Nestlé is the leading global maker of infant formula, the No. 1 pet-food maker, and a major chocolate producer. Nestlé generates about 60% of its sales from six key brands: Nestlé, Nestea, Nescafé, Purina, Maggi and Buitoni.
The Nestlé story still isn't well-known in the U.S. investment community. One of the major reasons: The shares are traded on the Pink Sheets, limiting institutional ownership and research coverage. As an over-the-counter stock, Nestlé is less liquid and carries a lower profile than the shares of such other major European companies as BP, Royal Dutch Shell, Vodafone and Unilever, which are New York Stock Exchange-listed. Average daily volume in Nestlé's American depository receipts is modest, at about 150,000 shares. The Swiss shares are more liquid.
A Pink-Sheet listing means investors can't find Nestlé's share price in newspapers, although quotes are easily available online through Yahoo!, Dow Jones' MarketWatch and other sources. It reports results semi-annually, and they conform to Swiss accounting standards.
Nestlé could easily meet NYSE listing requirements by reporting its results based on U.S. accounting standards in addition to Swiss standards, but has opted not to. "We don't perceive any benefit," says a Nestlé spokesman, noting that there are an ample 100 million U.S. ADRs outstanding; Brabeck wasn't available to speak to Barron's.
The listing issue doesn't bother Russo. "Nestlé's accounting is perfectly sufficient for me. U.S. GAAP isn't the only pure standard of accounting."
While there may be a strong asset story here, there isn't yet a break-up story. Nestlé management has shown no willingness to part with its 75% interest in Alcon, now valued at $28 billion, or its 27% interest in L'Oréal, now worth $14 billion. Those stakes account for almost 40% of Nestlé's $111 billion market value. Our calculation doesn't reduce the value of the Alcon and L'Oréal interests to account for any capital-gains taxes. Both Alcon and L'Oréal have been phenomenal investments for Nestlé since they were made in the 1970s. The big Swiss food outfit acquired Alcon for $276 million, and it paid a similar amount for its one-quarter stake in L'Oréal. While it's unclear whether Nestlé would pay any tax on the sale of either holding, it's notable that the Swiss didn't require any tax to be paid when Nestlé sold 25% of Alcon in a 2002 U.S. initial public offering.
Under an agreement with the Bettencourt family, a key L'Oréal shareholder, Nestlé can't buy additional L'Oréal shares before 2007 at the earliest, or sell or transfer L'Oréal stock through 2009.
No such restrictions exist with the Alcon stake. Alcon is a low-profile but phenomenal success story. It sells a range of eye-care products, including treatments for glaucoma, cataracts and infections; intraocular lenses; contact-lens solution; and artificial tears. Its shares have surged to 121 from 33 at the 2002 IPO. Alcon, however, isn't cheap, selling for 35 times estimated 2005 profits. Its $38 billion market value is equal to a stiff eight times annual sales.
Many U.S. investors are biased against European companies because they consider them weakly managed, relative to their American counterparts, and less oriented toward shareholders' interests. Just compare top-notch Procter & Gamble (PG) to its European rival, Unilever (UN) -- which only recently seems to have righted itself after years of restructurings.
Among the knocks against Nestlé is that it's too European, too long-term-oriented, too bureaucratic and too difficult to understand. And Brabeck, a 37-year Nestlé veteran, may not have the charisma of Gillette CEO Jim Kilts, or Hershey's Rick Lenny. That's on purpose. Brabeck has contrasted Nestlé's more deliberate management approach with the CEO-fixated "Anglo-Saxon" style, in which new chief executives often feel the need to shake up their organizations. "I get the feeling that in the Anglo-Saxon environment, the company is at the service of the CEO. At Nestlé, the CEO is at the service of the company," Brabeck said at a June investor conference.
By food-industry standards, Nestlé invests heavily in research and development, as it seeks to transform itself into more of a "health and nutrition company." One of its innovations is Dreyer's Slow-Churned ice cream that has half the fat and 25% fewer calories than regular Dreyer's (also sold as Edy's), yet has a premium-quality taste. Nestlé has shown that being environmentally friendly can pay off. It cut its water use by 37% in factories and energy consumption by 24% per unit since 2000. This plays well in eco-friendly Western Europe.
![[foods]](http://online.barrons.com/public/resources/images/b-nestle_f109162005161859.jpg)
Nestlé has focused on water, ice cream and pet food. It's also a big producer of frozen foods.
|
|
Brabeck has countenanced one American innovation: a share buyback: Nestlé began its first repurchase program in July. It's admittedly modest, at 1 billion Swiss francs ($800 million), and is due to end at the close of 2005. But Nestlé has vowed to step up the buybacks in 2006. Analysts estimate that the buyback could total 2 billion Swiss francs in 2006 and perhaps 4 billion francs in 2007. A Swiss franc is worth about 80 U.S. cents.
Another rap against Nestlé is that it's always on the verge of a major, dilutive acquisition. The reality is that Nestlé has shown restraint in recent years. Its last major purchase came in 2002, when it paid $2.6 billion for Chef America, the maker of Hot Pockets frozen foods. Wolfgang Reichenberger, Nestlé's chief financial officer, has said that Nestlé "doesn't see a major acquisition in front of us." Brabeck says that in several critical areas, like pet food, water and U.S. ice cream, Nestlé has all the scale it needs.
The lack of a major deal has allowed Nestlé to begin its repurchase program because the company has been able to pay down debt related to prior acquisitions with its ample cash flow. Nestlé has an old-fashioned attachment to its prized triple-A credit rating. Net debt, now a very manageable $10 billion, had to come down before Nestlé would consider a buyback program.
For all the criticism of Nestlé's acquisitive ways, its three big deals this decade, Ralston-Purina, Chef America and Dreyer's, have turned out pretty well. The $10 billion Ralston deal, completed in 2001, nearly doubled Nestlé's sales in the high-growth pet food market. The company was shrewd enough to put the management of its entire global pet-food business in the hands of Ralston's talented team, based in St. Louis.
Nestlé's profile on Wall Street has risen somewhat in the past year, for an unfavorable reason. The company got into a well-publicized spat with some big institutional investors over whether Brabeck should also assume the role of chairman, following the retirement of Rainer Gut from that post earlier this year. Nestlé prevailed, in what really amounted a tempest in a teapot, or perhaps a coffee pot. (Nestlé is one of the world's largest coffee makers with its Nescafé brand.)
It's true that Nestlé historically has separated the roles of chairman and CEO, and many companies are deciding that one person shouldn't wear both hats. Yet Brabeck's wish to hold both jobs for a limited time hardly seems an affront to good corporate governance. Nestlé is expected to name a new CEO in several years, while keeping Brabeck as chairman.
OPERATING IN EUROPE, Nestlé doesn't have the same flexibility that American companies do to shut factories and lay off workers, if conditions deteriorate. Nestlé, however, is unwilling to cave in to what it views as unreasonable labor demands. Last year, it threatened to sell Perrier because of a disagreement with a union at its Perrier factory in southern France, which was only about a quarter as productive as its San Pellegrino plants. Nestlé decided to keep Perrier after the union agreed to job cuts and to boost productivity.
The Swiss food conglomerate was founded in 1866 by Henri Nestlé, who had developed a cereal-based infant formula for babies whose mothers had died or couldn't breast-feed. This was a breakthrough, because the children of such mothers sometimes died, since the other breast-milk alternatives used until then weren't sufficiently nutritious. Nestlé grew by acquisitions into the early 20th century, focusing on milk. Milk-related products remain the company's largest revenue source, followed by beverages (mostly water and coffee), frozen and other prepared foods, candy and pet food.
Nestlé entered the chocolate market in the 1920s and developed the first instant coffee, Nescafé, in the 1930s. Nescafé got a big boost during World War II when the U.S. army provided it to the troops.
After the war, Nestlé began expanding into Latin America and the rest of the developing world. Nestlé is now the dominant maker of infant formula outside the U.S. But in the American market, it badly trails Bristol-Myers Squibb (BMY), the maker of Enfamil, and Abbott Laboratories (ABT), the producer of Similac.
![[Brabeck]](http://online.barrons.com/public/resources/images/b-Nestle_f309162005161409.jpg)
Brabeck: "In the Anglo-Saxon environment, the company is at the service of the CEO. At Nestlé, the CEO is at the service of the company."
|
|
Nestlé's overseas formula business ignited controversy in the 1980s after critics attacked Nestlé for urging poorly educated mothers in the developing world to forsake superior breast milk for formula -- leading to isolated boycotts of the company's products. Worse, Nestlé's powdered formula required water, which often was unclean. Nestlé has largely defused the formula issue with strict marketing rules. For example, the company acknowledges the superiority of breast milk, and won't advertise or give out free samples in the developing world.
Size can breed arrogance. In infant formula, Nestlé took a long time to reach an agreement with Martek Biosciences (MATK), which produces DHA, a fatty acid critical to brain and eye development that is present in breast milk but not cow's milk, the basis for formula. While Nestlé's rivals, notably Bristol-Myers Squibb and American Home Products, embraced DHA a decade ago, Nestlé didn't seal its deal with Martek until 2003. Nestlé's view, apparently, was that it was so big, it didn't need DHA. DHA-boosted formula now dominates the U.S. market and is growing abroad.
Nestlé is battling throughout the world to maintain its market-leading positions. In the U.S., Nestlé is the No. 1 seller of bottled water, with an estimated 40% share, thanks to a portfolio of solid regional brands, including Poland Spring in the Northeast and Arrowhead in the West. But Coca-Cola (KO) and PepsiCo (PEP), faced with an eroding soda market, have been seeking to expand into the growing water market, using their powerful bottling networks. Coke has Dasani; Pepsi, Aquafina.
"Nestlé's goal is to maintain and defend its share, and it has done a good job," says Bill Pecoriello, the beverage analyst at Morgan Stanley. "Nestlé is the low-cost product because it owns its own springs and produces its own packaging." Nestlé, for instance, dominates the important warehouse-club market, which has a rising share of the U.S. water market.
Looking ahead, analysts and investors see several potential merger opportunities for Nestlé. One scenario floated by Sanford Bernstein's Wood is that the company could ultimately buy the rest of L'Oréal. That likely would cost $40 billion or more. Yet Nestlé could finance nearly all the cost with the sale of its Alcon stake and L'Oréal's 10% interest in the European drug maker Sanofi-Aventis. Such a deal would create a "mammoth" consumer-goods company, with 50% more sales than Procter & Gamble, Wood wrote in a research note. Any action on L'Oréal would have to wait until at least 2007.
A final, mega-deal could involve Coca-Cola. This would be the ultimate merger of equals, since Coke and Nestlé have similar market values. Combining the two would give Nestlé's water and beverage units access to Coke's global bottling network, while providing diversification for Coke at a time when its core soda franchise is eroding. But insular Coke is unlikely to make such a move any time soon.
Then again, Nestlé could keep prospering without making any deals. While many of its rivals are in the doldrums, Nestlé's strong brands and developing-world exposure probably give it the food industry's best outlook.
Making the story even better: Nestlé's Alcon and L'Oréal interests effectively give its stock one of the sector's lowest P/E multiples. It's unusual to find an industry leader with a cheap valuation. Nestlé holders should be dining well in the coming years.

